
PC PAL OCX Growth Chart Components
Integrating growth charts components into electronic medical systemsThe help documentation for the Growth Chart component contains 4 distinct parts:
For marketing brochure, contact and purchase information, please visit the growthcharts.info website.
The PC PAL OCX Growth Chart component needs to be directly integrated into a medical host system by a developer. There is no complete user interface such as in PC PAL GrowthXP application. There is no server, nor any database. All these services are provided by the host application. Patient data is only saved in the host application's database and provided by code to the component.
The chart drawing module is limited to displaying, manipulating, printing and exporting of charts. If the host system is web based, the component can be integrated server-side (generating images or PDF files) or client-side (as an installed and registered component). The client-side integration (e.g. in a desktop application) gives full interactive access to the chart for zooming, hints/flyovers, chart settings etc.
The Growth Chart component is a Windows 32-bit OCX control that can be installed on Windows client or server and used from other applications (desktop or web-based). Generally all Windows editions are supported, namely Windows 32 and 64-bit, Windows 10, 11. If used on a server for image or PDF generation (in web services or web-based solutions), then supported server systems are Windows 32 or 64-bit editions 2012, 2016, 2019 and 2022.
The host software application (desktop client or web page) needs to send to represent medical data on a graph sheet. The graph sheet's attributes allows choosing the graph template to be drawn. The actual drawing is done using the patient's medical data, sent to the component using the patient and visit data objects.
See below an overview schema of the main components:
- Introduction - overview description
- Frequently Asked Questions - "how to" questions and answers with code examples
- Summary - list of included type libraries and interfaces
- Detailed documentation - help for each type library, interface, property and method
For marketing brochure, contact and purchase information, please visit the growthcharts.info website.
The PC PAL OCX Growth Chart component needs to be directly integrated into a medical host system by a developer. There is no complete user interface such as in PC PAL GrowthXP application. There is no server, nor any database. All these services are provided by the host application. Patient data is only saved in the host application's database and provided by code to the component.
The chart drawing module is limited to displaying, manipulating, printing and exporting of charts. If the host system is web based, the component can be integrated server-side (generating images or PDF files) or client-side (as an installed and registered component). The client-side integration (e.g. in a desktop application) gives full interactive access to the chart for zooming, hints/flyovers, chart settings etc.
The Growth Chart component is a Windows 32-bit OCX control that can be installed on Windows client or server and used from other applications (desktop or web-based). Generally all Windows editions are supported, namely Windows 32 and 64-bit, Windows 10, 11. If used on a server for image or PDF generation (in web services or web-based solutions), then supported server systems are Windows 32 or 64-bit editions 2012, 2016, 2019 and 2022.
The host software application (desktop client or web page) needs to send to represent medical data on a graph sheet. The graph sheet's attributes allows choosing the graph template to be drawn. The actual drawing is done using the patient's medical data, sent to the component using the patient and visit data objects.
See below an overview schema of the main components:
Frequently Asked Questions#
Question How to install the PC PAL Growth Charts component?
#
Answer
PC PAL supplies specific installers for each version. If you didn't receive yours write an e-mail to info@pcpal.eu or use this contact form.
If the default installation doesn't suit the machine or the host application, the component can also be installed "manually". Create a batch file (e.g. install.bat) as in the example below, save it in the same folder as the normal installer and launch it using the following parameters:
The example below will install the specified component files in the subfolder called "extract".
If the default installation doesn't suit the machine or the host application, the component can also be installed "manually". Create a batch file (e.g. install.bat) as in the example below, save it in the same folder as the normal installer and launch it using the following parameters:
- pass the installer file name as first parameter
- -u - uninstall
The example below will install the specified component files in the subfolder called "extract".
[+] Example
@Echo OFF
SET QUITE=-q

SET OCXName=%1
SET OCXName=%OCXName:~0,-3%ocx

if (%2)==(-u) goto Uninstall

Echo Install AX %OCXName%
%1 /X extract
rem @Echo ON
extract\AxReg extract\GraphObjIntf.tlb %QUITE%
extract\AxReg extract\GraphXIntf.tlb %QUITE%
extract\AxReg extract\%OCXName% %QUITE%
Goto End

:Uninstall
Echo Uninstall AX %OCXName%
rem @Echo ON
extract\AxReg extract\%OCXName% %QUITE% -u
extract\AxReg extract\GraphXIntf.tlb %QUITE% -u
extract\AxReg extract\GraphObjIntf.tlb %QUITE% -u

:End
Question How to check whether the component is correctly installed?
#
Answer Please follow the next steps (Administrator rights are needed to do this test):
Once the snap-in is installed and the console file is saved, click on it on the left side tree.
In the middle part of the MMC console view the default chart is shown, with toolbar and other visual elements. If this works, the component is correctly installed on the machine.
For Windows 64-bit editions:
Please use "mmc -32" to launch the 32-bit MMC console.
- Create a new MMC console (hit Start or Start/Run and type "mmc").
- Use File/Add/remove snap-in menu option
- Select "ActiveX Control" from the list of available snap-ins, then click Add.
- A wizard for selecting the specific component to be added is shown. Click the Next button.
- Select the component to be used from the list of installed components on the system, then click Next.
- Select a friendly name for the component, or leave it unchanged, then click Finish.
- Save the MMC console file for future use (e.g. "GrowthCharts.msc")
Once the snap-in is installed and the console file is saved, click on it on the left side tree.
In the middle part of the MMC console view the default chart is shown, with toolbar and other visual elements. If this works, the component is correctly installed on the machine.
For Windows 64-bit editions:
Please use "mmc -32" to launch the 32-bit MMC console.
Question Where are the component files installed by default?
#
Answer By default, the files are installed in the
C:\Windows\system32\GrowthChartOcx folder.
For Windows 64-bit editions, as the component is compiled as 32-bit, the files are copied to
C:\Windows\SysWOW64\GrowthChartOcx.
C:\Windows\system32\GrowthChartOcx folder.
For Windows 64-bit editions, as the component is compiled as 32-bit, the files are copied to
C:\Windows\SysWOW64\GrowthChartOcx.
Question How to get the installed component's version?
#
Answer Use the version property of graph component interface.
The version string is formed by the major version, the minor version, the release and the build numbers with a dot as separator: e.g. 2.0.0.8.
[+] Example
[VB]
if AGraph.Version < "2.0.0.0" then
  MsgBox "Unsupported graph component version"+AGraph.Version
end if

[Delphi]
if AGraph.Version < '2.0.0.0' then
  ShowMessage('Unsupported graph component version'+AGraph.Version);
Question How to activate debug logs?
#
Answer
For any other integration problem there is the possibility to save a debug log file.
First, copy the delivered map file (e.g. USGrowthCharts.map) in the same folder.
Second, create a file with the same name as the OCX, but with the ini extension (e.g. USGrowthCharts.ini), in the same folder. Add the following content:
You can use any log file name (e.g. MyError.log, US.error.log etc.). The component will output any error in the specified log file, in the same folder. The user under which the component runs needs to have write access to the folder. Otherwise, please specify the full path for the LogFile.
Second, create a file with the same name as the OCX, but with the ini extension (e.g. USGrowthCharts.ini), in the same folder. Add the following content:
[Debug]
LogFile=Debug_USGrowthCharts.log
You can use any log file name (e.g. MyError.log, US.error.log etc.). The component will output any error in the specified log file, in the same folder. The user under which the component runs needs to have write access to the folder. Otherwise, please specify the full path for the LogFile.
Question What to do in case of deployment issues? (e.g. 64-bit, license or rights issues)
#
Answer
First, make sure you have a valid license file and that the file is copied in the deployment folder.
The license files are small files with the "lic" extension (e.g. USGrowthChart.lic).
Other things to check:
Other things to check:
- Give the user under which the host application is running the right to access the user profile and the folder where the component is deployed.
- Run web applications (e.g. ASP/ASP.NET) under a local or domain account (no special, nor default account). The user account needs to have a valid and accessible user profile on the server machine.
- Web applications need to run the component from IIS pools with 32-bit applications enabled.
- Make sure the same identity is used on both the IIS pool and the server application's virtual folder.
- In case of license storage errors, sometimes the cause is that the user profile is not loaded by the system.
To fix it (in IIS 7 or later), edit the Application pool, check the Identity and set the flag LoadUserProfile to True in the Advanced Settings.
Question How to do a side-by-side Windows deployment using manifests?
#
Answer Add or update your application manifest (e.g. app.exe.manifest) to point to the component's manifest file. See an example below.
Make sure to use the correct growth charts component name (e.g. rename GrowthCharts.SXS as NorwegianGrowthCharts.SXS), it must match the manifest file name.
Download the appropriate manifest file for your component and copy the manifests (app.exe.manifest and *GrowthChart.SXS.manifest) in your application folder. Here are the download links for the available manifests:
Note: if you rename the manifest or change its content, you need to refresh the side-by-side Windows cache by changing the version in the App.exe.manifest (under assembly/assemblyIdentity).
Download the appropriate manifest file for your component and copy the manifests (app.exe.manifest and *GrowthChart.SXS.manifest) in your application folder. Here are the download links for the available manifests:
- USGrowthCharts.SXS.manifest
- AustrianGrowthCharts.SXS.manifest
- BelgianGrowthCharts.SXS.manifest
- CanadianGrowthCharts.SXS.manifest
- FrenchGrowthCharts.SXS.manifest
- GermanGrowthCharts.SXS.manifest
- IcelandicGrowthCharts.SXS.manifest
- NorwegianGrowthCharts.SXS.manifest
- SwedishGrowthCharts.SXS.manifest
- UKGrowthCharts.SXS.manifest
- WHOGrowthCharts.SXS.manifest
Note: if you rename the manifest or change its content, you need to refresh the side-by-side Windows cache by changing the version in the App.exe.manifest (under assembly/assemblyIdentity).
[+] Example
<?xml version="1.0" encoding="UTF-8" standalone="yes"?>
<assembly xmlns="urn:schemas-microsoft-com:asm.v1" manifestVersion="1.0">
  <assemblyIdentity
              type = "win32"
              name = "App"
              version = "1.0.0.0" />
  <dependency>
    <dependentAssembly>
      <assemblyIdentity
                  type="win32"
                  name="GrowthCharts.SXS"
                  version="1.0.0.0" />
    </dependentAssembly>
  </dependency>
</assembly>
Question What are the available control names, classes and interfaces?
#
Answer Here is the list of PC PAL Growth Chart components included in this documentation.
They are also listed in the Summary section.
These control names can be used to locate the control on selection lists (e.g. in Visual Studio, MMC snap-ins etc.). The class names can be used to instantiate a new control by code.
The interface names can be used to manipulate a growth charts control by code.
All interfaces inherit IGraphX interface, which can be used to manipulate any specific growth charts control.
The host application should dispose/free the allocated memory after use (e.g. [VB] Graph=Nothing).
| Edition | Growth charts control | Interface name |
| USA | US Growth charts library component | IUSAllGraph |
| Austria | Austrian Graph Control | IAustrianGrowthChartsGraph |
| Belgium | Belgian Graph Control | IBelgianGrowthChartsGraph |
| Canada | Canadian Graph Control | ICanadianGrowthChartsGraph |
| France | French Graph Control | IFrenchGrowthChartsGraph |
| Germany | German Graph Control | IGermanGrowthChartsGraph |
| Iceland | Icelandic Graph Control | IIcelandicGrowthChartsGraph |
| Norway | Norwegian Graph Control | INorwegianGrowthChartsGraph |
| Sweden | Swedish Graph Control | ISwedishGrowthChartsGraph |
| UK | UK Graph Control | IUKGrowthChartsGraph |
| WHO, Intl | WHO growth charts control | IWHOGrowthChartsGraph |
The interface names can be used to manipulate a growth charts control by code.
All interfaces inherit IGraphX interface, which can be used to manipulate any specific growth charts control.
The host application should dispose/free the allocated memory after use (e.g. [VB] Graph=Nothing).
Question How to choose the graph template?
#
Answer Set the Template property of graph attributes class with
the corresponding ID of the template. Most of the components contain a single template (e.g. USA, Swedish etc.).
The following example shows how to choose a template by using its name.
The following example shows how to choose a template by using its name.
[+] Example
[VB]

Private Function GetTemplateID(AName As String) As Integer
  With AGraphOcx.GraphAttributes.TemplatesList
    For I = 0 To .Count - 1
      If AName = .Names(I) Then
        GetTemplateID = I
        Exit Function
      End If
    Next I
    GetTemplateID = -1
  End With
End Function

Private Sub BtnGetTemplateID_Click()
  With AGraphOcx.GraphAttributes
  .Template = GetTemplateID("Swedish")
  .ApplyAttributes
End With
End Sub
Question How to adjust the graph's display quality?
#
Answer To improve the display quality of the graph, especially when displayed in smaller size, an image processing technology has been implemented (available from version 1.4.0.0).
In most cases the display quality doesn't need to be modified, as it has been set to a value that suits most situations.
However, if the default quality settings still need to be adapted, an INI file needs to be created with the same name as the component, with the following section and commands:
- DisplayQuality is used when the component draws directly to the screen.
- ExportQuality is used when the component exports an image.
This adjusts the display quality on screen or when exporting the chart as an image.
The values are expressed in pixels. A higher value consumes more memory and may slow down the image rendering. To inactivate image processing set the value to 0.
Question How to set legend values?
#
Answer The legend values have 3 parts: the symbol, the title and the unit. In this version the titles and units can be changed.
E.g. by default, for the "FatherHeight" field, the legend shows:
These properties override the default values shown by the legend.
By default no unit is shown. If needed, a unit label can be set in the UnitName property of the field definition.
- F - FatherHeight: 175,0
- F - Father's height: 175,0 cm
These properties override the default values shown by the legend.
By default no unit is shown. If needed, a unit label can be set in the UnitName property of the field definition.
Question How to setup patient and visit data (example in ASP)?
#
Answer The patient and visit data are added into the component data using the PatientData and VisitData properties.
For the PatientData, the gender ("IsMale") and date of birth ("BirthDate") fields are very important, as the reference data is specific to girls or boys and calculations are done based on the chronological age ("CA").
The measurements are added to VisitData property for each date ("DateVisit").
Important changes:
- The visits can only be added in chronological order (birth first, then the first visit, until the most recent visit) .
- Duplicate visit dates are not supported anymore and should not be added to the component VisitData.
- Birth should be added as a first visit, at the same date, in VisitData.
These changes affect the latest Growth Charts components: for US and Norwegian components after version 2, for Swedish and Icelandic components after version 3 and for WHO component version 1 and later.
In case the visits order is not respected (or duplicate visit dates) an exception is raised, with the message "Visits are not ordered by ascending date".
See below an example how to correctly setup the patient and visit data using ASP.
The order of Response.ContentType set and Response.BinaryWrite call in the example below is important, please use the order given here as example.
[+] Example
[ASP]
<%
Set Graph = Server.CreateObject("USGrowthCharts.USAllGraph")
with Graph
  .ClearData

  with .PatientData
  .Field("ID") = "1222-5556"
  .Field("SurName") = "Test1"
  .Field("FirstName") = "Test2"
  .Field("IsMale") = True
  .Field("BirthDate") = #2/25/2015#
  end with

  with .VisitData
    With .New
    .Field("DateVisit") = #2/25/2015#
    .Field("Height") = 50
    End With

    With .New
    .Field("DateVisit") = #6/25/2015#
    .Field("Height") = 52
    End With

    With .New
    .Field("DateVisit") = #12/25/2015#
    .Field("Height") = 54
    End With
  End With

  .Changed

  Response.ContentType = "image/jpeg"
  Response.BinaryWrite(.ExportBinaryAs( "JPEG", 420, 594, 0)) '0 = ldsDefault
End With
%>
Question How to know which parameters are required by a calculation?
#
Answer The below table shows the parameters requested by each calculation.
Each row describes a calculation, with the parameters being listed as columns with vertical titles.
On each calculation row the required parameters are marked with an X in the corresponding intersection cells.
A calculations or parameter field can occur once per patient or once per visit. The Legend table below shows the representation for each field type and kind in the matrix table (patient -> grey background, calculation -> blue text).
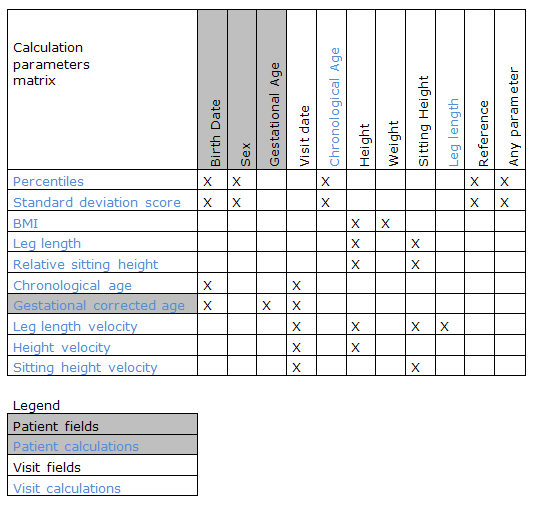
Fig. Calculation parameters matrix.
A calculations or parameter field can occur once per patient or once per visit. The Legend table below shows the representation for each field type and kind in the matrix table (patient -> grey background, calculation -> blue text).
Fig. Calculation parameters matrix.
Question How works the conversion from supplied string values to numerical/date values?
#
Answer The character string values supplied by the host application to the PC PAL Growth Charts component are converted as needed to numerical or date values.
The conversion is automatic and it uses the local Windows regional settings. If the application is running on a server, using IIS, then the server's regional settings are used.
The local short date format and the decimal separators are used, so extra caution is needed to avoid errors and wrong conversions.
Here is an example for a server using the "mm/dd/yyyy" short date format and the "." decimal separator:
And another example, for a server using the "dd/mm/yyyy" short date format and the "," decimal separator:
The local short date format and the decimal separators are used, so extra caution is needed to avoid errors and wrong conversions.
Here is an example for a server using the "mm/dd/yyyy" short date format and the "." decimal separator:
With .PatientData
  .Field("BirthDate") = "2/25/2012"
  .Field("BL") = "45.91"
  .Field("BW") = "3.500"
End With
And another example, for a server using the "dd/mm/yyyy" short date format and the "," decimal separator:
With .VisitData
  With .New
  .Field("DateVisit") = "25/6/2013"
  .Field("Height") = "50,1"
  End With
End With
Question What interactive features are available when the component is integrated in a desktop application?
#
Answer Once the growth chart component has the focus, interactive features like zooming, selecting and the chart toolbar are available to the host application users.
-
Zooming using the mouse only
Zooming a specific area is possible by selecting the area using the mouse (click top-left and drag to bottom-right corner). This can be done multiple times for better refinement. The opposite movement (click bottom-right and drag to top-left direction) goes to previous zoom state. -
Zooming using the keyboard only
The user can use the keyboard to zoom-in (Ctrl, +), zoom-out (Ctrl, -) or reset zoom to full page (Ctrl, 0). -
Zooming using the mouse and the keyboard
The chart zooming is also available by holding the Ctrl key while rolling the mouse wheel.
When the mouse is over the curve or the chart reference area, holding the Alt key shows the local X and Y scales and the exact value under the mouse pointer.
When the chart is zoomed Space + mouse drag moves the visible area. - Using the zoom tools
Wheel-click shows the zoom navigation map.
Ctrl, wheel-click shows the local magnifier.

Constants:
- ldsDefault = 0 (Long)
- ldsDotted = 1 (Long)
- ldsDithered = 2 (Long)
- belongs to GraphX basic interface component (GraphXIntf.tlb)
Properties: Color, Enabled, GraphAttributes, GraphSheet, PatientData, Transparent, Visible, VisitData, ZoomState
Methods: Changed, ClearData, Draw, ExportAsJPEG, ExportBinaryAs, ExportFileAs, Print, PrinterSetup, PrinterSetupEx, PrintEx
Parameter(s):
- Dc : Long
- Left : Long
- Top : Long
- Right : Long
- Bottom : Long
Parameter(s):
- FileName : String
- Width : Long
- Height : Long
- LineDrawStyle : TXLineDrawStyle (see GraphXIntf-TXLineDrawStyle)
Parameter(s):
- Format : String
- Width : Long
- Height : Long
- LineDrawStyle : TXLineDrawStyle (see GraphXIntf-TXLineDrawStyle)
Parameter(s):
- FileName : String
- Format : String
- Width : Long
- Height : Long
- LineDrawStyle : TXLineDrawStyle (see GraphXIntf-TXLineDrawStyle)
Parameter(s):
- PrintSetupInfo : Unknown
Parameter(s):
- Dc : Long
- Left : Long
- Top : Long
- Right : Long
- Bottom : Long
- belongs to GraphX basic interface component (GraphXIntf.tlb)
Procedure OnGraphPointClick (see GraphXIntf-IGraphXEvents-OnGraphPointClick)
- belongs to GraphXIntf-IGraphXEvents interface
- belongs to GraphXIntf-IGraphXEvents interface
Parameter(s):
- ClickVisit : ITXVisitData (see GraphObjIntf-ITXVisitData)
- ClickVisitField : String
Procedure OnGraphPointHint (see GraphXIntf-IGraphXEvents-OnGraphPointHint)
- belongs to GraphXIntf-IGraphXEvents interface
- belongs to GraphXIntf-IGraphXEvents interface
Parameter(s):
- HintVisit : ITXVisitData (see GraphObjIntf-ITXVisitData)
- HintVisitField : String
- HintStr : String
Constants:
- zsPageWidth = 0 (Long)
- zsPageHeight = 1 (Long)
- zsSelection = 2 (Long)
- belongs to GraphX Utility object interfaces component (GraphObjIntf.tlb)
Properties: MainReference, Name, Objects, Properties, References, ShadowReference, Visible, XField, YField
Property Name: String (Read-Only) (see GraphObjIntf-ITXVisualObject-Name)
- belongs to GraphObjIntf-ITXChart interface
- belongs to GraphObjIntf-ITXChart interface
Property Properties: Variant (Read-Write) (see GraphObjIntf-ITXVisualObject-Properties)
- belongs to GraphObjIntf-ITXChart interface
- belongs to GraphObjIntf-ITXChart interface
Parameter(s):
- Index : Variant
Property Visible: Boolean (Read-Write) (see GraphObjIntf-ITXVisualObject-Visible)
- belongs to GraphObjIntf-ITXChart interface
- belongs to GraphObjIntf-ITXChart interface
- belongs to GraphX Utility object interfaces component (GraphObjIntf.tlb)
[+] Example
[Delphi]
var
  AChartList: ITXChartList;
  I: Integer;
begin
  AChartList := AGraphOcx.GraphSheet.Charts;
  for I:= 0 to AChartList.Count-1 do
     ShowMessage(AChartList[I].Name);
end;

[VB]
Dim AChartList As ITXChartList, I As Integer
Set AChartList = AGraphOcx.GraphSheet.Charts
For I = 0 to AChartList.Count-1
  MsgBox AChartList(I).Name
End For
Parameter(s):
- Index : Variant
- belongs to GraphX Utility object interfaces component (GraphObjIntf.tlb)
[+] Example
[VB]
1. Using For

Dim AList As ITXCustomObjectList
Set AList = AGraphOcx.GraphSheet.Charts
For i = 0 To AList.Count - 1
  MsgBox AList.Objects(i).Name
Next i

2. Using For Each

Dim AList As ITXCustomObjectList
Dim AObject As ITXObject
Set AList = AGraphOcx.GraphSheet.Charts
For Each AObject In AList
  MsgBox AObject.Name
Next AObject
Parameter(s):
- Index : Variant
- belongs to GraphX Utility object interfaces component (GraphObjIntf.tlb)
[+] Example
[Delphi]
with AGraphOcx.PatientData.FieldDef['FatherHeight'] do
begin
  Title := 'Father''s height';
  UnitName := 'cm';
  DisplayFormat := '0.00';
end;

with AGraphOcx.VisitData.FieldDef['DateVisit'] do
begin
  Title := 'Visit date';
  DisplayFormat := 'yyyy/mm/dd';
end;

[VB]
With AGraphOcx.PatientData.FieldDefs("FatherHeight")
  .Title = "Father's height"
  .UnitName = "cm"
  .DisplayFormat = "0.00"
End With

With AGraphOcx.VisitData.FieldDefs("DateVisit")
  .Title = "Visit date"
  .DisplayFormat = "yyyy/mm/dd"
End With
- belongs to GraphX Utility object interfaces component (GraphObjIntf.tlb)
Parameter(s):
- Index : Variant
- belongs to GraphX Utility object interfaces component (GraphObjIntf.tlb)
Properties: AgeRange, AgeRangesList, GraphType, GraphTypesList, Name, Properties, Template, TemplatesList
Methods: ApplyAttributes
[+] Example
[VB]
'US specific example
Set Graph = Server.CreateObject("USGrowthCharts.USAllGraph")
'Show the US Individual "BMI 2-20 yrs" chart
With Graph.GraphAttributes
    .template = 0    '0 - USA
    .graphtype = 0   '0 - Individual
    .agerange = 2    '5 - BMI 2-20 yrs
    .ApplyAttributes
End With

[VB]
'WHO specific example
Set Graph = Server.CreateObject("WHOGrowthCharts.XWHOGrowthCharts")
'Show the WHO "BMI 2-5 years" chart
With Graph.GraphAttributes
    .template = 0    '0 - WHO
    .graphtype = 1   '1 - 2-5 years
    .agerange = 2    '2 - BMI 2-5 yrs
    .ApplyAttributes
End With
Property AgeRangesList: ITXTemplateItemList (Read-Only)
- belongs to GraphObjIntf-ITXGraphAttributes interface
- belongs to GraphObjIntf-ITXGraphAttributes interface
Property GraphTypesList: ITXTemplateItemList (Read-Only)
- belongs to GraphObjIntf-ITXGraphAttributes interface
- belongs to GraphObjIntf-ITXGraphAttributes interface
Property TemplatesList: ITXTemplateItemList (Read-Only)
- belongs to GraphObjIntf-ITXGraphAttributes interface
- belongs to GraphObjIntf-ITXGraphAttributes interface
- belongs to GraphX Utility object interfaces component (GraphObjIntf.tlb)
Property Properties: Variant (Read-Write) (see GraphObjIntf-ITXObject-Properties)
- belongs to GraphObjIntf-ITXGraphSheet interface
- belongs to GraphObjIntf-ITXGraphSheet interface
Parameter(s):
- Index : Variant
- belongs to GraphX Utility object interfaces component (GraphObjIntf.tlb)
Parameter(s):
- Index : Variant
- belongs to GraphX Utility object interfaces component (GraphObjIntf.tlb)
Parameter(s):
- ObjID : Variant
- belongs to GraphX Utility object interfaces component (GraphObjIntf.tlb)
[+] Example
[VB]
AGraphOcx.PatientData.Field("BirthDate") = #6/1/2010#

[Delphi]
AGraphOcx.PatientData.Field['BirthDate'] := EncodeDate(2010, 06, 01);

//change the SurName label for tables and legend
AGraphOcx.PatientData.FieldDefs['SurName'].Title := 'New Surname Title';
Changed;
Parameter(s):
- FieldId : Variant
Property FieldDefs: ITXDataFieldDefList (Read-Only)
- belongs to GraphObjIntf-ITXPatientData interface
- belongs to GraphObjIntf-ITXPatientData interface
- belongs to GraphX Utility object interfaces component (GraphObjIntf.tlb)
[+] Example
[Delphi]
var
  AReference: ITXReference;
begin
  AReference := AGraphOcx.GraphSheet.Charts['Bottom'].References[0];
  ShowMessage(AReference.Name);
end;

[VB]
Dim AReference As ITXReference
Set AReference = AGraphOcx.GraphSheet.Charts("Bottom").References(0)
MsgBox (AReference.Name)
- belongs to GraphX Utility object interfaces component (GraphObjIntf.tlb)
[+] Example
[VB]
1. Using enumeration syntax

'this code sample fills-up a previously defined combobox with all available references
Dim AReference As ITXReference
With AGraphOcx.GraphSheet.Charts("ChartName")
  For Each AReference In .References
    ComboBox1.AddItem (AReference.Name)
  Next AReference
End With

2. By name

'this code sample sets a chart's reference
Dim AReference As ITXReference
With AGraphOcx.GraphSheet.Charts("ChartName")
  Set AReference = .References("ReferenceName")
End With
Parameter(s):
- Index : Variant
- belongs to GraphX Utility object interfaces component (GraphObjIntf.tlb)
[+] Example
[VB]
'this code shows all available templates
Dim ATemplates As ITXTemplateItemList
Set ATemplates = AGraphOcx.GraphAttributes.TemplatesList
For i = 0 To ATemplates.Count - 1
  MsgBox (ATemplates.Names(i))
Next i
Parameter(s):
- Index : Long
- belongs to GraphX Utility object interfaces component (GraphObjIntf.tlb)
- belongs to GraphX Utility object interfaces component (GraphObjIntf.tlb)
[+] Example
[VB]

With AGraphOcx.GraphSheet.Tools("PreviewToolBar")
    'hides ZoomPage button from the toolbar
    .ShowZoomPage = False

    'print current page
    .Print = True

    'hide toolbar
    .Active = False
End With

[Delphi]
V:= GraphX.GraphSheet.Tools['SettingsObject'];
V.ShowCorrectedAge:= not V.ShowCorrectedAge;
V.ShowCurveDiscontinuity:= not V.ShowCurveDiscontinuity;
V.Apply:= True;
Parameter(s):
- Index : Variant
- belongs to GraphX Utility object interfaces component (GraphObjIntf.tlb)
[+] Example
[VB]
With AGraphOcx.VisitData(0)
  MsgBox "Date " + Str(.Field("DateVisit")) + " : Height = " + Str(.Field("Height"))
End With
Parameter(s):
- FieldId : Variant
- belongs to GraphX Utility object interfaces component (GraphObjIntf.tlb)
Methods: New
[+] Example
[VB]
Set Graph = Server.CreateObject("USGrowthCharts.USAllGraph")
with Graph
    'adds all visits in a list
    'e.g. Date: 02/04/2008; Height: 120 cm
    listVisits.Clear
    Dim AItem As String
    For i = 0 To .VisitData.Count - 1
      AItem = "Date: " + Str(.VisitData(i).Field("DateVisit"))
      If .VisitData(i).Field("Height") Then
          AItem = AItem + "; " + .VisitData.FieldDefs("Height").Title + _
            ": " + Str(.VisitData(i).Field("Height")) + _
            " " + .VisitData.FieldDefs("Height").UnitName
      End If
      listVisits.AddItem (AItem)
    Next i
end with


[VB]
With AGraphOcx.VisitData(0)
  MsgBox "Date " + Str(.Field("DateVisit")) + " : Height = " + Str(.Field("Height"))
End With
Property FieldDefs: ITXDataFieldDefList (Read-Only)
- belongs to GraphObjIntf-ITXVisitDataList interface
- belongs to GraphObjIntf-ITXVisitDataList interface
Parameter(s):
- Index : Long
- belongs to GraphX Utility object interfaces component (GraphObjIntf.tlb)
Constants:
- mbLeft = 0 (Long)
- mbRight = 1 (Long)
- mbMiddle = 2 (Long)
- belongs to Austrian growth charts component (AustrianGrowthCharts.ocx - version 1.0.0.1)
Methods: OnActivate, OnClick, OnCreate, OnDblClick, OnDeactivate, OnDestroy, OnGraphPointClick, OnGraphPointHint, OnKeyPress, OnPaint
Parameter(s):
- Key : Integer
- belongs to Austrian growth charts component (AustrianGrowthCharts.ocx - version 1.0.0.1)
Properties: Active, Color, Enabled, GraphAttributes, GraphSheet, PatientData, Transparent, Visible, VisitData, ZoomState
Methods: Changed, ClearData, Draw, ExportAsJPEG, ExportBinaryAs, ExportFileAs, Print, PrinterSetup, PrinterSetupEx, PrintEx
Property Active: Boolean (Read-Only)
- belongs to AustrianGrowthCharts-IAustrianGrowthChartsGraph interface
- belongs to AustrianGrowthCharts-IAustrianGrowthChartsGraph interface
Constants:
- mbLeft = 0 (Long)
- mbRight = 1 (Long)
- mbMiddle = 2 (Long)
- belongs to Belgian growth charts component (BelgianGrowthCharts.ocx - version 2.1.0.5)
Methods: OnActivate, OnClick, OnCreate, OnDblClick, OnDeactivate, OnDestroy, OnGraphPointClick, OnGraphPointHint, OnKeyPress, OnPaint
Parameter(s):
- Key : Integer
- belongs to Belgian growth charts component (BelgianGrowthCharts.ocx - version 2.1.0.5)
Properties: Active, Color, Enabled, GraphAttributes, GraphSheet, PatientData, Transparent, Visible, VisitData, ZoomState
Methods: Changed, ClearData, Draw, ExportAsJPEG, ExportBinaryAs, ExportFileAs, Print, PrinterSetup, PrinterSetupEx, PrintEx
Property Active: Boolean (Read-Only)
- belongs to BelgianGrowthCharts-IBelgianGrowthChartsGraph interface
- belongs to BelgianGrowthCharts-IBelgianGrowthChartsGraph interface
Constants:
- mbLeft = 0 (Long)
- mbRight = 1 (Long)
- mbMiddle = 2 (Long)
- belongs to Canadian growth charts component (CanadianGrowthCharts.ocx - version 1.0.0.2)
Methods: OnActivate, OnClick, OnCreate, OnDblClick, OnDeactivate, OnDestroy, OnGraphPointClick, OnGraphPointHint, OnKeyPress, OnPaint
Parameter(s):
- Key : Integer
- belongs to Canadian growth charts component (CanadianGrowthCharts.ocx - version 1.0.0.2)
Properties: Active, Color, Enabled, GraphAttributes, GraphSheet, PatientData, Transparent, Visible, VisitData, ZoomState
Methods: Changed, ClearData, Draw, ExportAsJPEG, ExportBinaryAs, ExportFileAs, Print, PrinterSetup, PrinterSetupEx, PrintEx
[+] Example
[VB]
Set Graph = Server.CreateObject("CanadianGrowthCharts.XCanadianGrowthCharts")
'Show the Canadian "BMI 2-19 yrs"
With Graph.GraphAttributes
    .template = 0    '0 - Canadian
    .graphtype = 0   '0 - Canadian charts
    .agerange = 2    '2 - BMI 2-19 yrs
    .ApplyAttributes
End With
Property Active: Boolean (Read-Only)
- belongs to CanadianGrowthCharts-ICanadianGrowthChartsGraph interface
- belongs to CanadianGrowthCharts-ICanadianGrowthChartsGraph interface
- belongs to French growth charts component (FrenchGrowthCharts.ocx - version 2.1.0.8)
Methods: OnActivate, OnClick, OnCreate, OnDblClick, OnDeactivate, OnDestroy, OnGraphPointClick, OnGraphPointHint, OnKeyPress, OnPaint
Parameter(s):
- Key : Integer
- belongs to French growth charts component (FrenchGrowthCharts.ocx - version 2.1.0.8)
Properties: Active, Color, Enabled, GraphAttributes, GraphSheet, PatientData, Transparent, Visible, VisitData, ZoomState
Methods: Changed, ClearData, Draw, ExportAsJPEG, ExportBinaryAs, ExportFileAs, Print, PrinterSetup, PrinterSetupEx, PrintEx
[+] Example
[VB]
Set Graph = Server.CreateObject("FrenchGrowthCharts.XFrenchGrowthCharts")
'Show the French "Croissance - Taille 0-20 ans" chart
With Graph.GraphAttributes
    .template = 0    '0 - French
    .graphtype = 0   '0 - Français
    .agerange = 1    '1 - Croissance - Taille 0-20 ans
    .ApplyAttributes
End With
Property Active: Boolean (Read-Only)
- belongs to FrenchGrowthCharts-IFrenchGrowthChartsGraph interface
- belongs to FrenchGrowthCharts-IFrenchGrowthChartsGraph interface
- belongs to German growth charts component (GermanGrowthCharts.ocx - version 2.1.0.7)
Methods: OnActivate, OnClick, OnCreate, OnDblClick, OnDeactivate, OnDestroy, OnGraphPointClick, OnGraphPointHint, OnKeyPress, OnPaint
Parameter(s):
- Key : Integer
- belongs to German growth charts component (GermanGrowthCharts.ocx - version 2.1.0.7)
Properties: Active, Color, Enabled, GraphAttributes, GraphSheet, PatientData, Transparent, Visible, VisitData, ZoomState
Methods: Changed, ClearData, Draw, ExportAsJPEG, ExportBinaryAs, ExportFileAs, Print, PrinterSetup, PrinterSetupEx, PrintEx
[+] Example
[VB]
Set Graph = Server.CreateObject("GermanGrowthCharts.XGermanGrowthCharts")
'Show the German "Wachstumsgeschw. 0-20 J." chart
With Graph.GraphAttributes
    .template = 0    '0 - German
    .graphtype = 0   '0 - Norm
    .agerange = 3    '3 - Wachstumsgeschw. 0-20 J.
    .ApplyAttributes
End With
Property Active: Boolean (Read-Only)
- belongs to GermanGrowthCharts-IGermanGrowthChartsGraph interface
- belongs to GermanGrowthCharts-IGermanGrowthChartsGraph interface
- belongs to Icelandic growth charts component (IcelandicGrowthCharts.ocx - version 3.0.0.9)
- belongs to Icelandic growth charts component (IcelandicGrowthCharts.ocx - version 3.0.0.9)
Properties: Color, Enabled, GraphAttributes, GraphSheet, PatientData, Transparent, Visible, VisitData, ZoomState
Methods: Changed, ClearData, Draw, ExportAsJPEG, ExportBinaryAs, ExportFileAs, Print, PrinterSetup, PrinterSetupEx, PrintEx
[+] Example
[VB]
Set Graph = Server.CreateObject("IcelandicGrowthCharts.XIcelandicGrowthCharts")
'Show the Icelandic "0-7 years" chart
With Graph.GraphAttributes
    .template = 0    '0 - Icelandic
    .graphtype = 0   '0 - Íslenska
    .agerange = 2    '2 - 0-7 ár
    .ApplyAttributes
End With
- belongs to Norwegian growth charts component (NorwegianGrowthCharts.ocx - version 2.1.0.21)
- belongs to Norwegian growth charts component (NorwegianGrowthCharts.ocx - version 2.1.0.21)
Properties: Color, Enabled, GraphAttributes, GraphSheet, PatientData, Transparent, Visible, VisitData, ZoomState
Methods: Changed, ClearData, Draw, ExportAsJPEG, ExportBinaryAs, ExportFileAs, Print, PrinterSetup, PrinterSetupEx, PrintEx
[+] Example
[VB]
Set Graph = Server.CreateObject("NorwegianGrowthCharts.XNorwegianGrowthCharts")
'Show the Norwegian "Height Weight 4-19 years" 2009 chart
With Graph.GraphAttributes
    .template = 0    '0 - Norwegian
    .graphtype = 0   '0 - 2009
    .agerange = 2    '2 - Lengde, Vekt 4-19 år
    .ApplyAttributes
End With
- belongs to Swedish growth charts component (SwedishGrowthCharts.ocx - version 3.1.0.43)
- belongs to Swedish growth charts component (SwedishGrowthCharts.ocx - version 3.1.0.43)
Properties: Color, Enabled, GraphAttributes, GraphSheet, PatientData, Transparent, Visible, VisitData, ZoomState
Methods: Changed, ClearData, Draw, ExportAsJPEG, ExportBinaryAs, ExportFileAs, Print, PrinterSetup, PrinterSetupEx, PrintEx
[+] Example
[VB]
Set Graph = Server.CreateObject("SwedishGrowthCharts.XSwedishGrowthCharts")
'Show the Swedish "BVC 2-7 years" chart
With Graph.GraphAttributes
    .template = 0    '0 - Swedish
    .graphtype = 0   '0 - Svenska
    .agerange = 1    '1 - 2-7 år
    .ApplyAttributes
End With
- belongs to UK growth charts component (UKGrowthCharts.ocx - version 2.1.0.8)
Methods: OnActivate, OnClick, OnCreate, OnDblClick, OnDeactivate, OnDestroy, OnGraphPointClick, OnGraphPointHint, OnKeyPress, OnPaint
Parameter(s):
- Key : Integer
- belongs to UK growth charts component (UKGrowthCharts.ocx - version 2.1.0.8)
Properties: Active, Color, Enabled, GraphAttributes, GraphSheet, PatientData, Transparent, Visible, VisitData, ZoomState
Methods: Changed, ClearData, Draw, ExportAsJPEG, ExportBinaryAs, ExportFileAs, Print, PrinterSetup, PrinterSetupEx, PrintEx
[+] Example
[VB]
Set Graph = Server.CreateObject("UKGrowthCharts.XUKGrowthCharts")
'Show the UK "BMI 0-20 years" chart
With Graph.GraphAttributes
    .template = 0    '0 - English
    .graphtype = 0   '0 - UK 2-18y
    .agerange = 4    '4 - BMI 0-20 years
    .ApplyAttributes
End With
Constants:
- pcvtHeight = 0 (Long)
- pcvtWeight = 1 (Long)
- pvctWeightForHeight = 2 (Long)
- pvctHeadCirc = 3 (Long)
- pvctBMI = 4 (Long)
- pvctCDCHeight = 5 (Long)
- pvctCDCWeight = 6 (Long)
- pvctCDCWeightForHeight = 7 (Long)
- pvctCDCHeadCirc = 8 (Long)
- pvctCDCBMI = 9 (Long)
- belongs to All US Growth charts library component (USGrowthCharts.ocx - version 2.1.0.21)
Parameter(s):
- ValueType : PCValueType (see USGrowthCharts-PCValueType)
- IsMale : Boolean
- ValueX : Double
- ValueY : Double
Parameter(s):
- ValueType : PCValueType (see USGrowthCharts-PCValueType)
- IsMale : Boolean
- ValueX : Double
- ValueY : Double
- belongs to All US Growth charts library component (USGrowthCharts.ocx - version 2.1.0.21)
Properties: Color, Enabled, GraphAttributes, GraphSheet, PatientData, Transparent, Version, Visible, VisitData, ZoomState
Methods: Changed, ClearData, Draw, ExportAsJPEG, ExportBinaryAs, ExportFileAs, Print, PrinterSetup, PrinterSetupEx, PrintEx
[+] Example
[VB]
Set Graph = Server.CreateObject("USGrowthCharts.USAllGraph")
'Show the US Clinical "Weight Height 2-20 yrs" chart
With Graph.GraphAttributes
    .template = 0    '0 - USA
    .graphtype = 1   '1 - Clinical
    .agerange = 2    '2 - Weight Height 2-20 yrs
    .ApplyAttributes
End With
- belongs to All US Growth charts library component (USGrowthCharts.ocx - version 2.1.0.21)
- belongs to WHO growth charts component (WHOGrowthCharts.ocx - version 1.0.0.5)
- belongs to WHO growth charts component (WHOGrowthCharts.ocx - version 1.0.0.5)
Properties: Color, Enabled, GraphAttributes, GraphSheet, PatientData, Transparent, Visible, VisitData, ZoomState
Methods: Changed, ClearData, Draw, ExportAsJPEG, ExportBinaryAs, ExportFileAs, Print, PrinterSetup, PrinterSetupEx, PrintEx
[+] Example
[VB]
Set Graph = Server.CreateObject("WHOGrowthCharts.XWHOGrowthCharts")
'Show the WHO "Height 0-2 years" chart
With Graph.GraphAttributes
    .template = 0    '0 - WHO
    .graphtype = 0   '0 - 0-2 years
    .agerange = 5    '5 - Length 0-2 yrs
    .ApplyAttributes
End With